Using Groups
Last updated on 2025-03-03
Overview
Groups are sets of variables within sections. You can also create nested groups simply by creating a group under an existing group.
This article contains the following sections:
Creating a Group
Groups can be created as follows:
- Hold down the CTRL key and select the elements to be included in the new group.
- Press CTRL+G or choose Group Variables in the context menu.
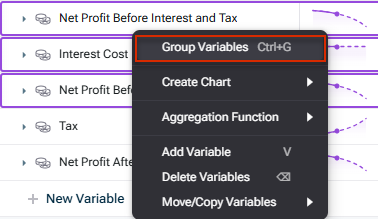
Grouping variables - Enter a name for the new group.
Aside from visual organisation in the spreadsheet, groups can also be used for:
Easily Adding Totals in the Spreadsheet and on Tables
- These totals will automatically stay up to date as new variables are added, or existing variables are removed, from the group/section.
- In the spreadsheet: hit the sum icon at the top of the group/section row (see Using Sections).
- On tables: add a group/section as a series to add its variables as well as a total row (see Using Sections).
Using Groups in Functions (Within Formulas)
Easily sum (or avg/min/max...) the variables within the group. Just type sum(Group Name) and xP&A will sum all the variables within that group. When variables are added to (or removed from) the group, the function (e.g. sum) will auto-update.
Keeping Variables on Tables in Sync With the Spreadsheet
If you add a Group to a table (as opposed to the individual variables), then the table will automatically stay up to date as variables are added/removed from the group in the spreadsheet (see Using Sections).
Table Headers
Organise variables under Group name headers on tables. You can toggle this setting off under Display | Show group headers.
 Display settings for table headers