Aggregating Data
Last updated on 2024-12-19
Overview
As an ESG Master, once you have approved the data submitted by all your reporting entities for an ESG report, you can aggregate this data at just a click of your mouse. The aggregated data are used to automatically generate a report containing the individual reporting data for the assigned reporting entities and the aggregated numerical data. The aggregated data are also prepared for the import into the Lucanet Disclosure Management solution for further processing.
Aggregating Data
To aggregate the ESG data:
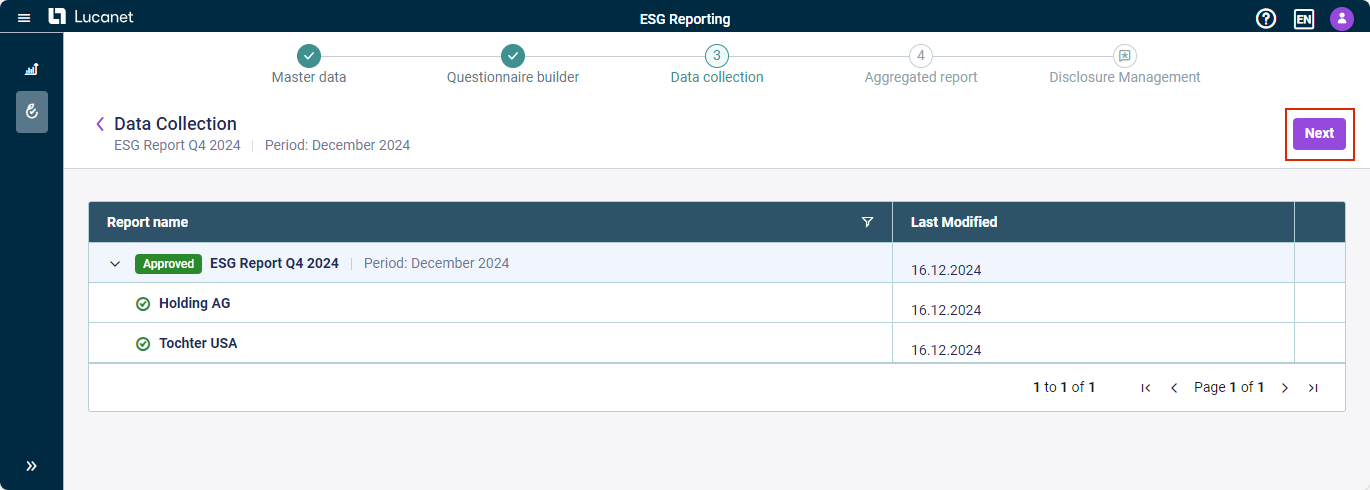
- If necessary, open Data Collection.
You will see all the data submitted by the respective reporting entities. The icon in front of the report name indicates the status of the data in question. This screen also shows when the report data in question were last modified. - Navigate to the approved report data.
Note: Before you can aggregate the ESG data, you must approve all the data submitted by the respective reporting entities. - Click Next.
The aggregated data are prepared for import into Lucanet Disclosure Management.
You can now also view the aggregated ESG report.
Viewing Responses Depending on Element Type
Depending on the element type, you have the following options to view detailed responses:
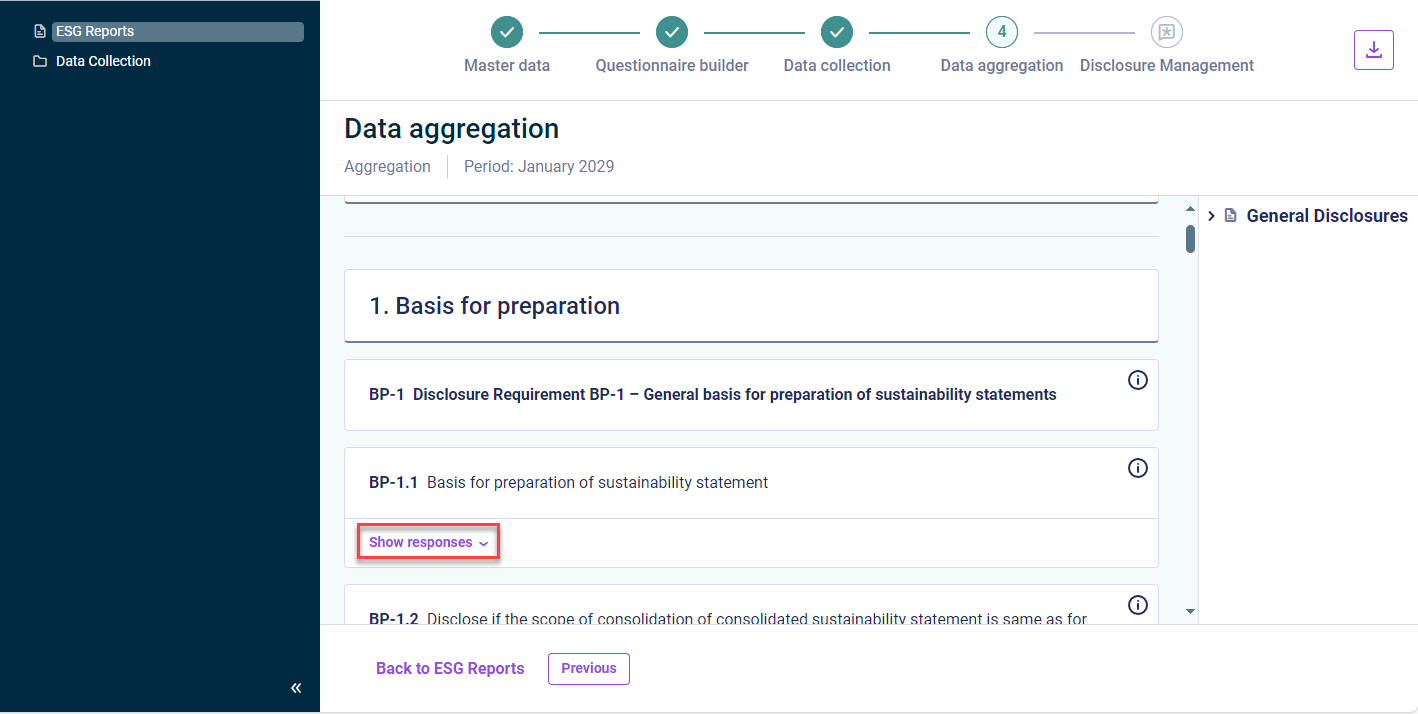
In general, you can use Show responses to view which reporting entity has provided which response for every question in the ESRS module:
For responses in the form of radio buttons, you can click Show explanation to access the explanation of the data collectors for their answer.
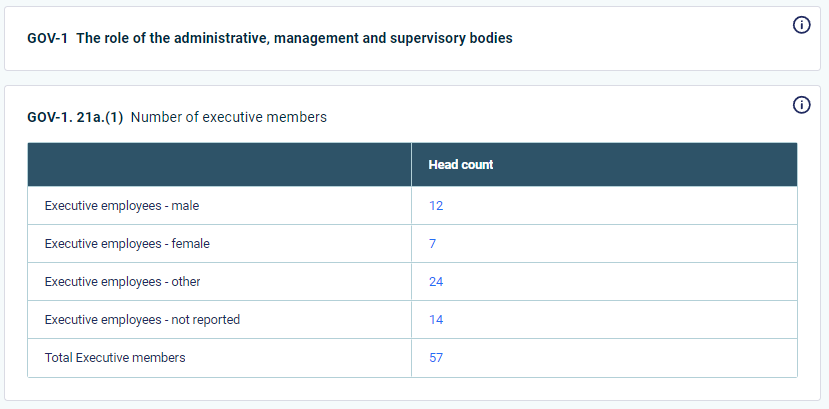
For responses provided in the form of data in tables, a table with the aggregated data is directly displayed. By double-clicking a cell with aggregated values, you can drill down to the individual values entered by each reporting entity:
You are able to view and access aggregated responses while the data collection phase is still ongoing. For a detailed information, see Displaying Aggregated Responses During Data Collection


